Learning Target: I can analyze energy transformations in a roller coaster.
|
Reading:
As you read this article, 1. find and highlight the definitions of gravitational potential energy and kinetic energy. 2. find and label the description of dissipated energy. |
| ||
Pie Charts:
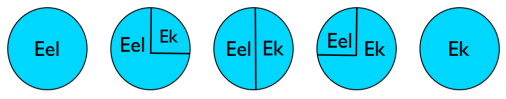
A pie chart is a circular graphic which is divided into slices to illustrate numerical proportions. For closed systems, pie charts are helpful in energy problems since the energy changes form while the total energy remains the same. In other words, the pie remains the same size (the total energy of the system) but the slices change sizes.
A pie chart is a circular graphic which is divided into slices to illustrate numerical proportions. For closed systems, pie charts are helpful in energy problems since the energy changes form while the total energy remains the same. In other words, the pie remains the same size (the total energy of the system) but the slices change sizes.
Use what you have learned to track the energy conversions in the roller coaster practice handout!
| 2017_dissipated_energy_in_a_coaster_handout_copy.pdf |